How Amazon Sellers Are Increasing FBA Profit Margins Through Smarter Purchasing

Most advice about improving Amazon FBA margins focuses on the sell side: optimize PPC, reduce returns, negotiate FBA fees, raise prices without losing velocity. Those levers matter, but they operate in a narrow band, because Amazon's fee structure and competitive pricing dynamics limit how much margin you can recover on the sell side alone.
A growing number of sellers have found a different lever. Instead of trying to squeeze an extra point out of the sell side, they're working the buy side: changing what they pay for inventory and how much they buy at once.
Consider a seller paying $8.50 per unit on 500-unit orders from a supplier who charges $6.80 per unit at 2,500 units. That seller is paying 20% more in COGS on every restock cycle than a competitor buying the same product at volume, and the gap has nothing to do with Amazon fees or listing optimization.
This post looks at three purchasing approaches that sellers are using to expand margins, how the economics work, and a case study from a Top 500 Amazon seller whose margins improved by 550 basis points over six months.
Where Sellers Are Finding Margin on the Buy Side
For most FBA businesses, COGS is 30-50% of revenue. Amazon fees are 15-20%. Advertising is another 10-20%. COGS is the largest single cost component, and yet most margin optimization advice focuses on fees and ad spend rather than the cost of the product itself.
Sellers who focus on the buy side report that a few-point reduction in COGS moves the margin picture more than incremental savings on fees, because COGS is the bigger number. The purchasing strategies that show up most often: early-payment discounts, volume discounts, and counter-cyclical buying.
Three Purchasing Strategies Sellers Use
1. Early-Payment Discounts
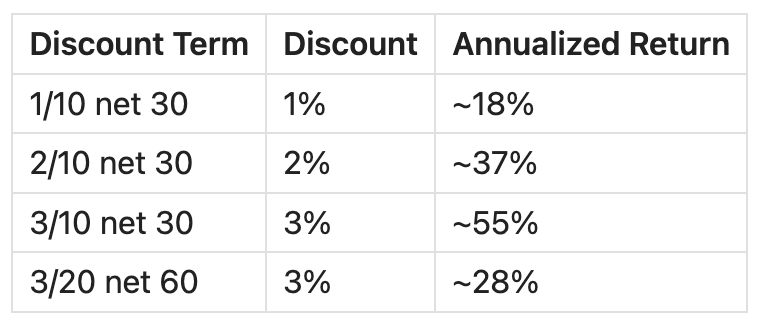
Many wholesale suppliers offer a discount for paying before the standard due date. The most common structure is 2/10 net 30: a 2% discount if the invoice is paid within 10 days, otherwise the full amount is due in 30 days. Variations include 1/10 net 30, 3/10 net 30, and 3/20 net 60.
Two percent per invoice may not sound significant, but the annualized economics are worth understanding.
Early-Payment Discount Annualized Return:
APR = (Discount % / (1 - Discount %)) x (365 / (Full Term Days - Discount Days))
For 2/10 net 30: (0.02 / 0.98) x (365 / 20) = 37.2%
According to the Institute of Finance and Management (IOFM), about 20% of purchase order invoices carry an early-payment discount opportunity. But only 27% of companies fully capture the discounts available to them. The best-performing companies capture 98%. That 71-point gap represents margin left on the table, and the primary reason companies miss discounts isn't that they don't want them. It's that they don't have the cash available when the discount window is open.
This is why 76% of suppliers, per IOFM research, offer better terms or prioritize fulfillment for customers who pay early. Suppliers have their own cash conversion cycles, and a buyer who pays on day 10 instead of day 45 is worth more to them than a buyer who orders 10% more product.
2. Volume and Bulk Discounts
Wholesale suppliers structure pricing in tiers. The specific breakpoints vary by category and supplier, but the pattern is consistent across consumer goods: ordering more units per PO gets a lower per-unit price, with jumps at freight-efficient thresholds like half-pallet and full-pallet quantities.
Typical volume discount structures in Amazon-relevant categories, based on data from Titan Network and SmartScout:
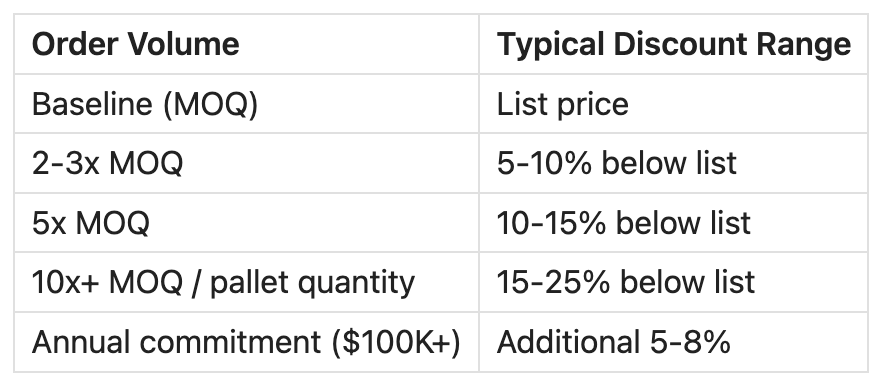
A seller moving from 500-unit orders to 2,500-unit orders on a product with $8.50 landed COGS at baseline might see their cost drop to $6.80 at the higher tier. On 10,000 annual units, that's $17,000 in annual COGS reduction on a single ASIN. Across a portfolio of 5 SKUs with similar economics, volume pricing alone can account for $50,000 to $85,000 per year in savings.
Most sellers already know their supplier offers price breaks. The reason they don't take advantage of them is simpler: a 2,500-unit order at $6.80 requires $17,000 upfront instead of $4,250 for 500 units. Sellers operating at the edge of their cash position end up buying smaller quantities at worse prices because they can't fund the larger order. Thinner margins produce less free cash, which funds smaller orders again.
3. Purchase Timing and Counter-Cyclical Buying
Sellers who order Prime Day inventory in March or April instead of June report saving $3,000-$7,000 in freight costs alone, before any per-unit pricing differences. Manufacturers and distributors have their own peak seasons, capacity constraints, and end-of-quarter incentives that create pricing windows.
Two patterns show up most often:
Pre-peak buying at off-peak prices. Prime Day inventory ordered in March or early April ships when suppliers still have capacity and before the summer order surge drives lead times out to 8-10 weeks. The same order placed in late May or June competes for capacity with every other seller who waited, often at higher per-unit costs and with expedited freight charges that can run $4 to $8 per kilogram.
End-of-quarter and end-of-year supplier incentives. Distributors in consumer goods frequently offer incremental discounts, extended terms, or bundled deals in the final weeks of a fiscal quarter to hit their own revenue targets. Sellers with capital available to place an order during these windows capture pricing that isn't available in the middle of the quarter.
Neither pattern requires insider access. It requires having capital available at the right time instead of having capital tied up in Amazon's disbursement cycle or locked in Amazon's account-level reserve.
How Some Sellers Stack These on a Single Order
The three strategies above can overlap. A seller placing a 5x-MOQ order in Q1 (off-peak), paying within 10 days, and timing the purchase during a supplier's quarter-end promotion can stack a 10% volume discount, a 2% early-payment discount, and a 3% promotional discount on the same PO. That's a combined 15% COGS reduction on a single order, before freight savings.
Not every order hits all three. But sellers who pay attention to the interactions between volume, payment timing, and purchase timing tend to capture more margin than those optimizing each in isolation.
Case Study: The Neato Company
The Neato Company is a 2P ecommerce partner for mid-market to enterprise consumer brands, operating as the exclusive authorized Amazon retailer for brands including Wiley Wallaby, Earth Animal, Dots Pretzels, and Illy Coffee. Founded in 2018, they employ 80+ people across 10 countries, generate nine-figure revenue, and have appeared on the Inc. 100 fastest-growing companies list three years running.
Neato's purchasing challenge was straightforward: under their standard 30- to 45-day supplier payment terms, they couldn't buy large enough quantities to capture bulk discounts, and they couldn't pay early enough to capture early-payment pricing. Their cash was tied up in the gap between paying suppliers and receiving Amazon disbursements.
Using Slope for invoice financing, Neato began paying suppliers on Day 1 of the invoice and ordering 90 days of inventory per purchase order instead of 30-45 days.
The results over a six-month period: Neato captured an average 10% discount on bulk inventory purchases by paying upfront. The discount was nearly four times the Slope financing fees, producing 350 basis points of instant margin expansion on Slope-financed inventory after netting out the cost of capital. Including secondary effects from higher sales velocity and delivery speed improvements, total margin expansion reached 550 basis points. Sales grew 15%.
The delivery speed effect is worth understanding separately. By stocking more inventory across more FBA regional centers, Neato cut delivery times by 1-2 days versus competitors, which fed into better organic search placement and higher sales velocity. The margin gains and the sales growth compounded each other rather than operating independently.
CEO Anthony Connelly described the economics: "With Slope, we were able to extend our inventory margins beyond what our typical 30- to 45-day terms with brands would have got us. Now we can go and buy 90 days' inventory by borrowing the money through Slope and paying brands on Day 1."
Read the full Neato case study →
Where This Pattern Shows Up Most
The purchasing approach tends to create the most value for sellers in a few specific situations.
Sellers whose suppliers already offer tiered pricing or early-payment discounts, but who haven't been able to take advantage of them because of cash constraints, are the most obvious fit. If a supplier offers one price regardless of volume or payment timing, the buy-side lever is weaker until terms are renegotiated.
Scale matters. A 10% bulk discount on a $2,000 order is $200. The same discount on a $20,000 order is $2,000. Sellers pursuing this approach tend to be at $200,000 or more in annual COGS, where the dollar value of available discounts starts to justify the operational complexity of managing larger orders.
Demand predictability matters too. Buying 90 days of inventory on a high-velocity ASIN with 18 months of sales history is a calculated decision backed by data. Buying 90 days of a product launched two months ago is speculation. Sellers using this approach tend to apply it selectively to proven SKUs, not across their entire catalog.
Where sellers report it doesn't work well: new product launches with uncertain demand, and highly seasonal one-off products where unsold inventory becomes a liability.
The Capital Constraint
The recurring theme in seller communities around buy-side optimization is that most sellers already know their supplier's volume tiers. The problem is their capital is already deployed.
Amazon's standard disbursement cycle pays sellers every 14 days, but with reserves, the effective delay from sale to cash-in-hand runs 21-35 days for most established sellers. The DD+7 policy adds another week for newer products. A seller doing $300,000 in monthly revenue might have $100,000 or more locked in Amazon's payout pipeline at any given time.
That capital can't fund a larger supplier order. So the seller buys 30 days at the baseline tier, sells through, waits for disbursement, and repeats. The seller who has access to working capital outside of the Amazon disbursement cycle can separate their purchasing timeline from their payout timeline, placing larger orders when the discount economics or supplier timing are favorable rather than when Amazon happens to release funds.
Slope's Amazon Line of Credit
For Amazon sellers who receive an offer through Seller Central, Slope's revolving line of credit* is available directly in the Amazon Lending portal. Revolving lines up to $5M, APRs as low as 8.99%, subject to credit approval and eligibility requirements. Supported by a J.P. Morgan credit facility, originated by Lead Bank, Member FDIC.
Each draw carries a fixed repayment schedule you set at the time of the draw — repayment does not accelerate based on revenue volume. As draws are repaid, the line replenishes for the next inventory cycle. The application uses a soft credit pull and does not affect your personal credit score. No personal guaranty required.
Check your eligibility in the Amazon Lending portal in Seller Central.
*Slope is a financial technology company, not a bank. Business-purpose loans made by Lead Bank and subject to credit approval. Application and consent to obtain personal credit report is required. Subject to minimum revenue and business requirements. Fees vary based on risk assessment and loan term.
Frequently Asked Questions
What is a good profit margin for Amazon FBA?
Net profit margins for Amazon FBA sellers typically range from 10% to 25%, depending on business model and category. Wholesale sellers average 10-20% (per Jungle Scout's 2024 State of the Seller report). Private label sellers with established products tend toward the higher end.
What percentage of Amazon FBA revenue goes to COGS?
COGS is typically 30-50% of revenue for Amazon FBA sellers. Wholesale sellers tend toward 40-50% (lower margins, higher volume). Private label sellers with overseas sourcing typically see 25-35% COGS ratios. COGS is the single largest cost component for most sellers, ahead of Amazon fees (15-20% of revenue) and advertising (10-20%).
How much discount can sellers expect for buying inventory in bulk?
Discount structures vary by supplier and category, but typical volume pricing in consumer goods follows a tier pattern: 5-10% at 2-3x minimum order quantity, 10-15% at 5x MOQ, and 15-25% at pallet quantities or 10x+ MOQ. Annual volume commitments above $100,000 often unlock an additional 5-8% beyond standard tier pricing. The specific numbers depend on the supplier relationship, product category, and order consistency.
What does 2/10 net 30 mean?
2/10 net 30 is a supplier payment term: a 2% discount is available if the invoice is paid within 10 days, otherwise the full amount is due in 30 days. The annualized return on taking the discount is approximately 37%, calculated as (0.02 / 0.98) x (365 / 20). Variations like 3/10 net 30 (3% for paying within 10 days, ~55% annualized) and 1/10 net 30 (1%, ~18% annualized) are also common in wholesale.
What is the annualized return on an early payment discount?
The formula is: APR = (Discount % / (1 - Discount %)) x (365 / Days Saved). For a 2/10 net 30 term, a buyer earns 2% by paying 20 days early, which annualizes to 37.2%. For 3/10 net 30, the annualized return is approximately 55%. These figures represent the opportunity cost of not taking the discount when the cash is available.
What is discount stacking?
Discount stacking is combining multiple supplier discounts on a single purchase order. A seller might stack a 10% volume discount for ordering 5x MOQ, a 2% early-payment discount for paying within 10 days, and a 3% end-of-quarter promotional discount for a combined 15% COGS reduction on one order. The three most common stackable discounts are volume/quantity tiers, early-payment/prepay discounts, and seasonal or promotional pricing.
When do suppliers typically offer the best pricing?
Two timing windows are commonly cited by sellers: off-peak ordering periods (buying Prime Day inventory in March/April before the summer order surge adds 4-6 weeks to lead times and $4-8/kg in expedited freight costs) and end-of-quarter windows (distributors in the final weeks of a fiscal quarter frequently offer incremental discounts or extended terms to hit revenue targets).
Does buying in bulk increase the risk of excess inventory?
Yes, larger orders carry more inventory risk. Sellers pursuing a bulk-buying approach tend to apply it selectively to established, high-velocity ASINs with 12+ months of sales data and predictable demand. For newer products, seasonal items, or categories with high trend volatility, smaller orders at higher per-unit cost may be the more conservative choice. The risk calculus shifts during peak events like Prime Day and Q4, when historical data supports higher stocking levels and the cost of a stockout often exceeds the cost of modest overstock.
This content is for informational and educational purposes only. It does not constitute financial, legal, or investment advice. Consult a qualified financial advisor before making any borrowing decisions.
Slope is a financial technology company, not a bank. Business-purpose loans made by Lead Bank and subject to credit approval. Application and consent to obtain personal credit report is required. Subject to minimum revenue and business requirements. Fees vary based on risk assessment and loan term.